
Search a city
Every multifamily listing the sources return, screened, then ranked on deal score.
Open city searchLoading…
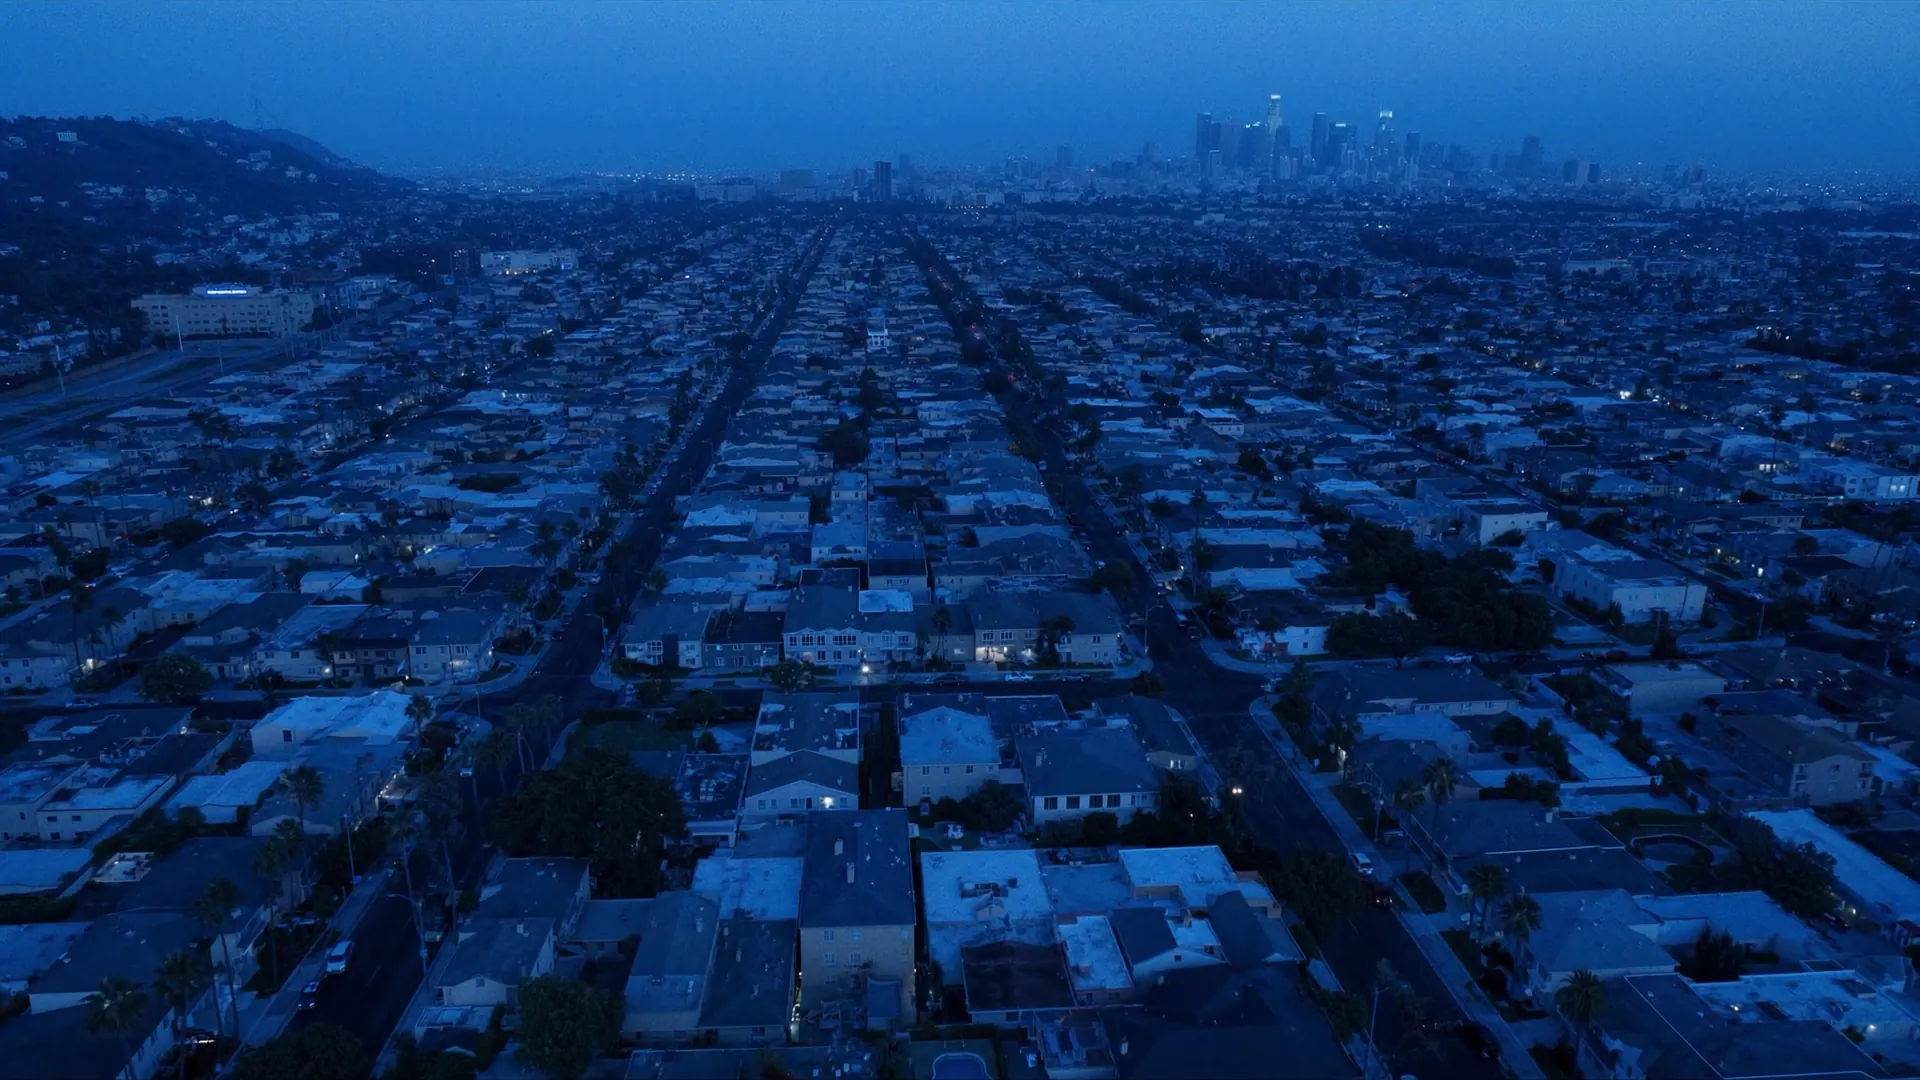
Aerial: illustrative render.
Ten specialist reads, a 10,000-path simulation and a pencil price on every multifamily listing. Under $2.50 a building.
Exhibit A · 5912 Willoughby Ave
Los Angeles · 12 units listed · county roll 10
Pencils at $2.48M: 14% under the ask, capped by the lender's DSCR floor.
DSCR at 70% LTV1.07× at the ask: under the floor
We look past the listing photo to the records behind 5912 Willoughby Ave. Press any part of the building to see what we found and where it came from.
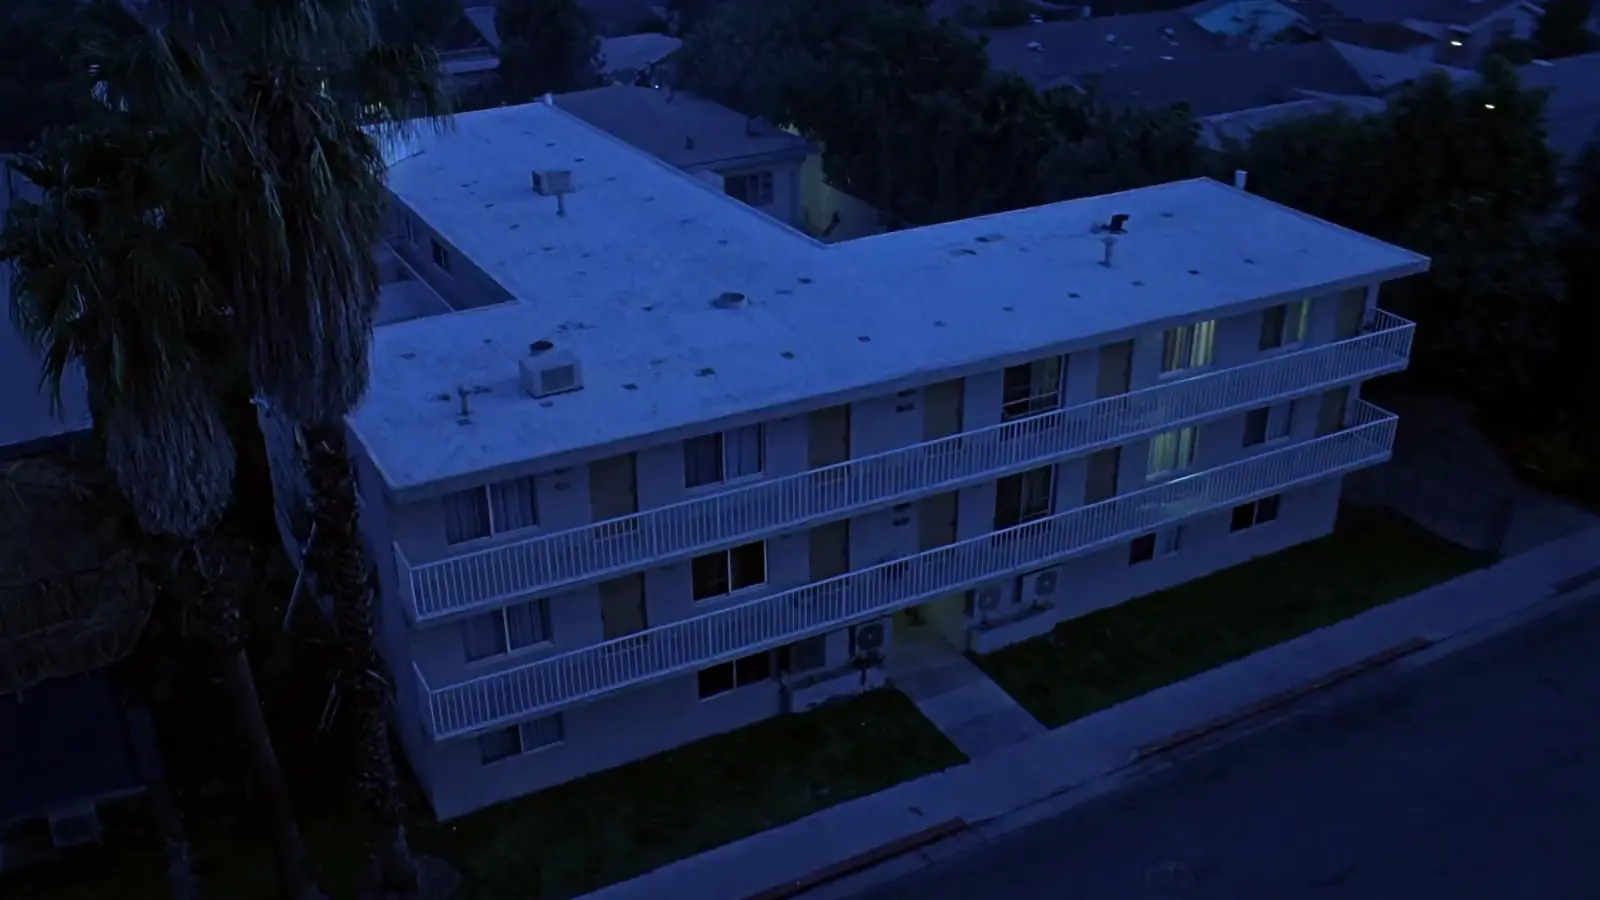
Illustrative building. The figures are 5912 Willoughby Ave.
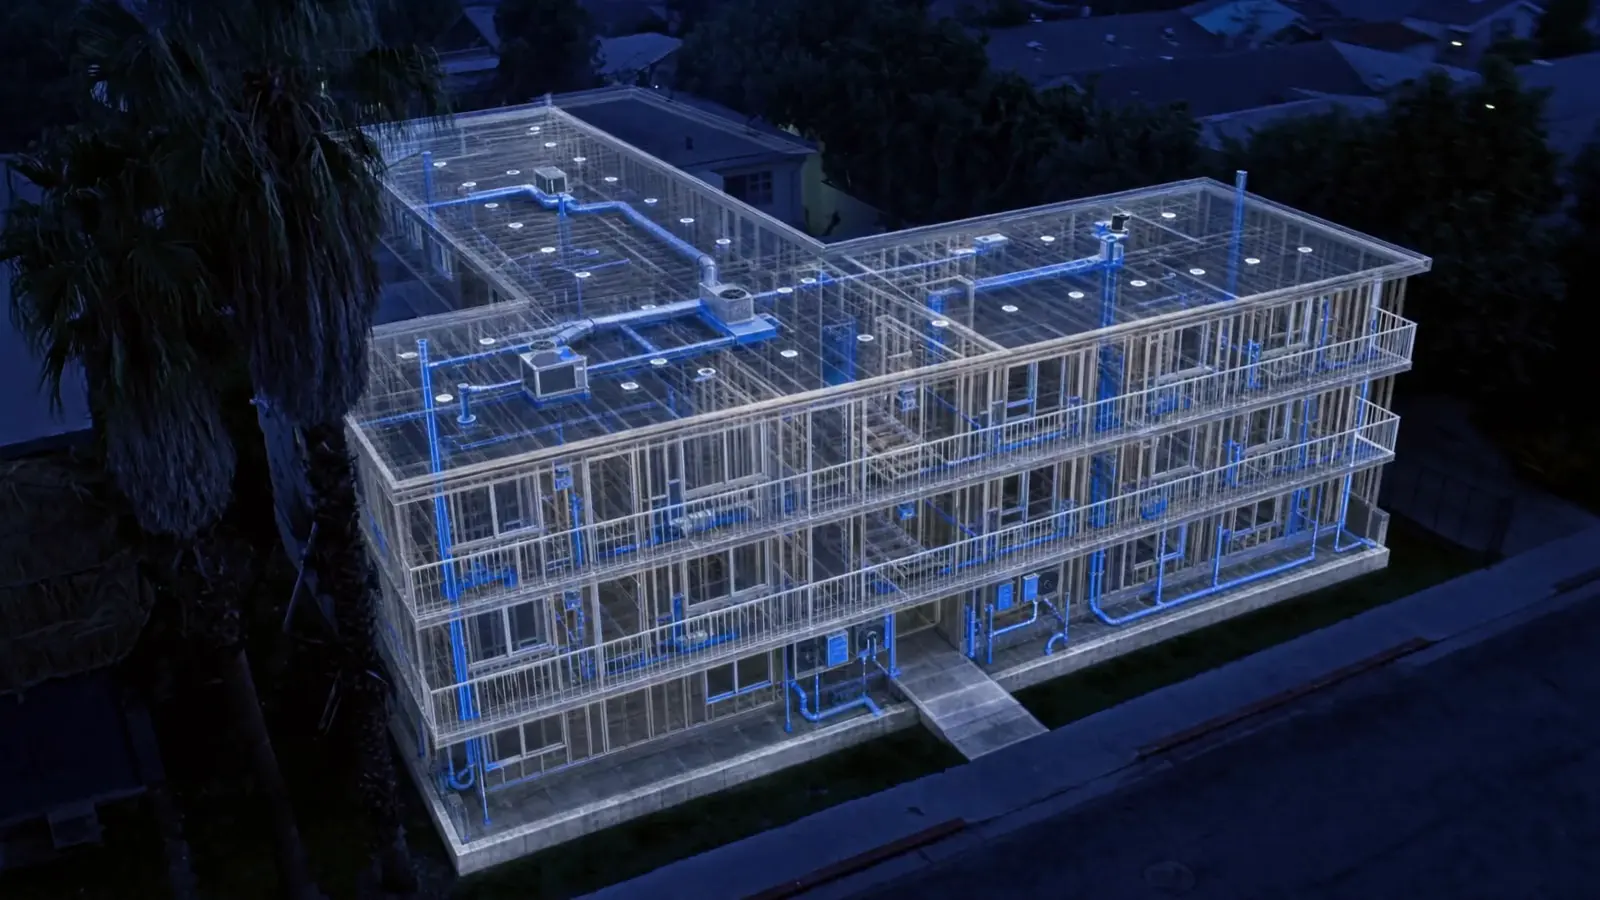
Illustrative building. The figures are 5912 Willoughby Ave.
Roof
Overdue, assumed from the 1979 build year
Estimated local replacement cost
$65K to $146K
HVAC
Overdue, assumed from the 1979 build year
Estimated local replacement cost
$68K to $162K
Plumbing
Due in 3 years, assumed from the 1979 build year
Estimated local replacement cost
$54K to $135K
Electrical
Permit open, issued in 2025; completion unconfirmed
Estimated local replacement cost
$41K to $113K
Windows
Overdue, assumed from the 1979 build year
Estimated local replacement cost
$49K to $130K
Foundation (seismic)
Not yet due, assumed from the 1979 build year
Estimated local replacement cost
$97K to $324K
County record
Does not match the listing, checked against the county roll
Listing: 12 units, built 2023. County roll: 10 units, built 1979.
Open Building record in the report| Specialist | Score | Weight |
|---|---|---|
| Investment | 38 | 18% |
| Market comps | 48 | 12% |
| Demographics | 70 | 13% |
| Location | 64 | 15% |
| Risk / return | 30 | 10% |
| Construction | 46 | 10% |
| Market signals | 52 | 4% |
| Environmental | 44 | 10% |
| Regulatory | 62 | 8% |
| City open data | 60 | Records |
One Los Angeles search, 8 listings, as the sources returned them. Rank them on deal score and the best one is a building you would have scrolled past.


Full report: all ten specialists Search screen: every result, before any credit
Photos are representative Los Angeles buildings, not these addresses.
Canterbury Apartments, Hollywood by Downtowngal, CC BY-SA 4.0; Embassy Apartments roof sign, Koreatown by Downtowngal, CC BY-SA 4.0; 4th and Catalina, Koreatown by Downtowngal, CC BY-SA 4.0; 1012 3rd Street, Santa Monica by ArnoldReinhold, CC BY-SA 3.0; 351 S Serrano by Downtowngal, CC BY-SA 4.0; 333 S Serrano by Downtowngal, CC BY-SA 4.0; El Greco Apartments by Los Angeles, CC BY-SA 3.0; Ronda, West Hollywood by Los Angeles, CC BY-SA 3.0.
Every multifamily listing the sources return, screened, then ranked on deal score.
Open city search
A LoopNet, Zillow, Realtor or Crexi link becomes the full read on that one building.
Paste a listing
The OM, rent roll and T-12 go into the ledger and get checked against the county.
Open the deal deskcity and county datasets across US cities: permits, violations, inspections, certificates of occupancy, zoning, parcels.
Free scan: 20 metros
See marketsExhibit B · 5912 Willoughby Ave
Slower rents. Higher costs. A weaker sale. See how the deal holds up when the assumptions change.
Try a scenario
+5.4%
5-year annualized return, including sale
Rents grow 3% a year. The sale assumes a 6.59% income yield.
14% finish at break-even or worse.
Saved sample. The four cases are separate checks; the chart shows the full Monte Carlo results.
These are the central assumptions; simulated years vary around them. A higher resale yield means a lower sale price for the same income.
Starting-year cash flow is $11,196 after operating costs, reserve and loan payments. This stays separate from the five-year returns.
Rent growth is 3% per year. The sale uses a 6.59% exit cap. Annualized return: +5.4%.
Each cell is a saved five-year annualized return. Rent growth changes across columns; resale cap changes down rows. The outlined cell is the base case. Vacancy and expense growth stay fixed in this grid.
The financial model is only part of the story. These specialists connect the income, the building and the neighborhood, so an attractive return doesn’t hide an expensive problem.
Open a role to see what it checks and why it matters.
3 specialists
Income, price and the downside.
4 specialists
The costs and constraints behind the photos.
3 specialists
The people and changes behind the rent.
All ten specialists are included on every active plan. Their findings become one memo, with the next questions to ask before you make an offer.
Exhibit D · Your month
By hand you screen every listing and fully underwrite a few. PropHunt fully underwrites all of them.
50 listings. By hand: screen 50, underwrite 5, 24 to 65 hours. PropHunt: underwrite all 50, about 2 hours of machine time, on Starter, $149 a month.
By hand: 5 to 30 minutes to screen each listing, then a preliminary underwrite of 4 to 8 hours for about 1 in 10 of them (published practitioner and vendor estimates: A.CRE, MotionCRE, AcquiOS). PropHunt: one full analysis timed at 141 seconds on the live product, times every listing, run one after another. One credit runs one analysis; the plan is the smallest whose monthly credits cover the month.
One credit runs one search or one full analysis. Top-ups from $45, never expire.
7-day free trial · card required, $0 today, cancel anytime
7-day free trial · card required, $0 today, cancel anytime
